
Still need help?

You can get the summary of submissions based on specific functions.
.png)
.png)
It is the heading of the summary block.
Aggregation means nothing but the total number of submissions in the app.
Sum - Calculates and displays the sum or addition of numerical values of submissions. If the submissions do not contain a numerical value, then it will display 0.
Count - Total number of submissions
Average - Calculates and displays the average of numerical values of submissions. If the submissions do not contain a numerical value, then it will display 0.
Minimum - Displays the minimum numerical values of submissions. If the submissions do not contain a numerical value, then it will display 0.
Maximum - Displays the minimum numerical values of submissions. If the submissions do not contain a numerical value, then it will display 0.
Examples:
Aggregation - Count
.png)
Aggregation - Sum
.png)
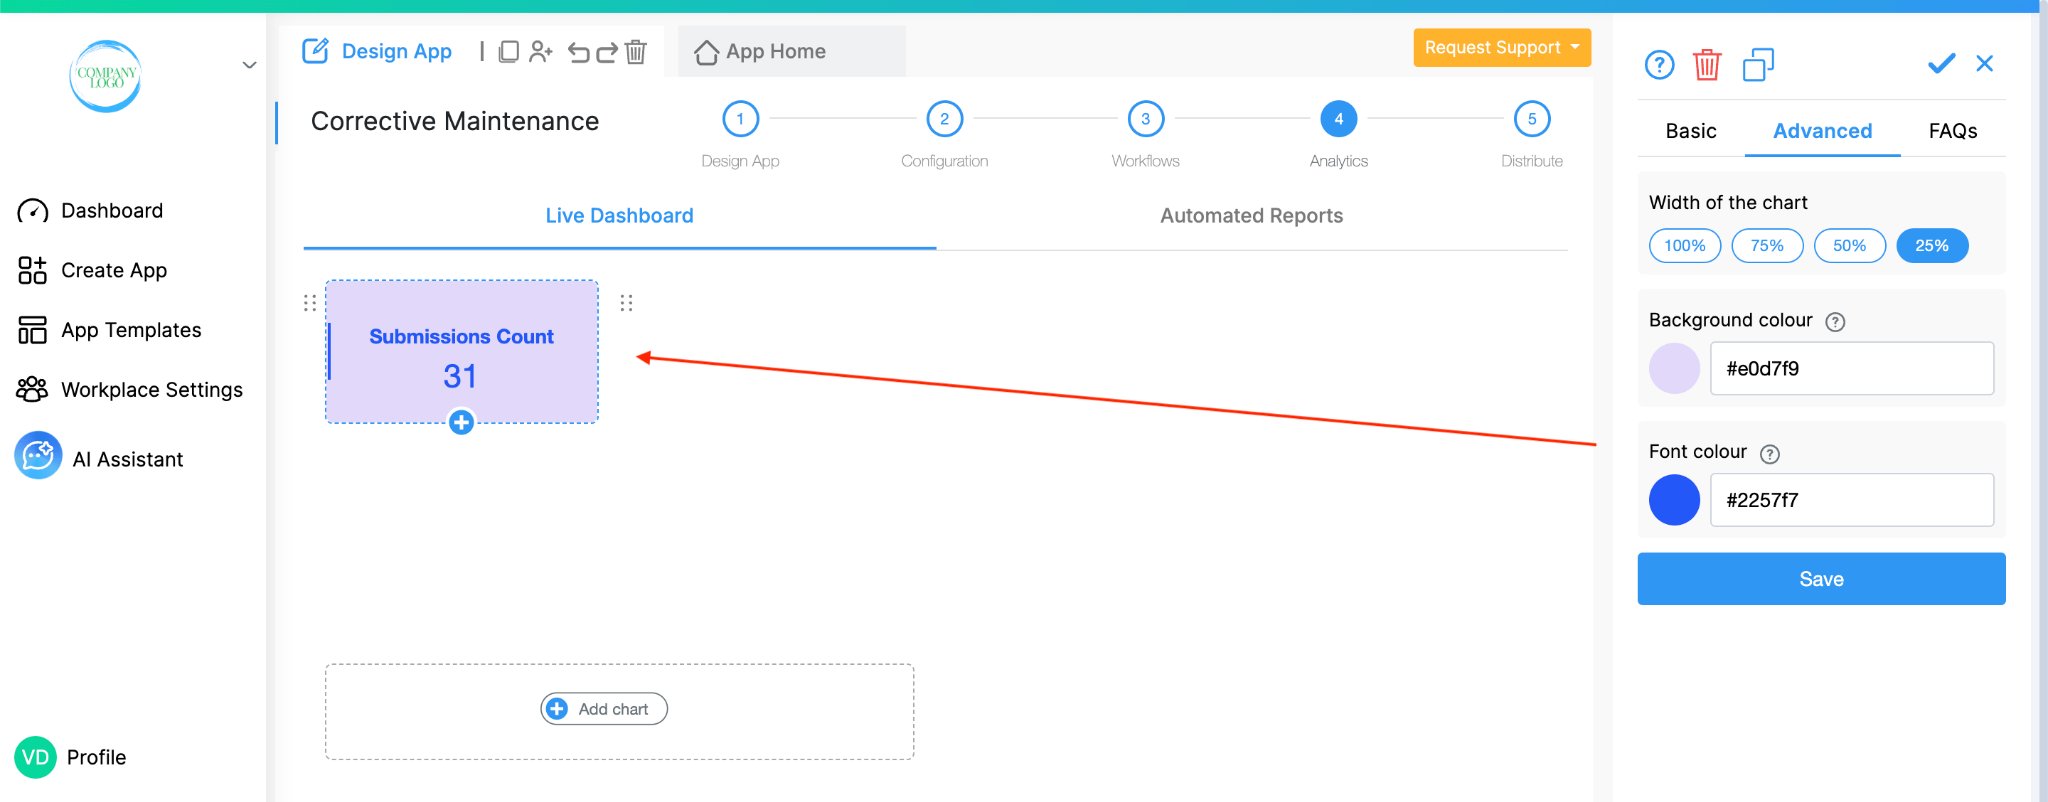
You can customise the appearance of Summary Charts by changing the background colour and font colour.
To do this, select the Summary Chart. On the right panel, go to the Advanced tab.
Under Background colour, choose the colour you want for the chart background.
Under Font colour, choose the colour you want for the text displayed in the chart.
After making the required changes, click Save to apply the selected colours to the Summary Chart.
L374, 1st Floor, 5th Main Rd, Sector 6, HSR Layout, Bengaluru, Karnataka 560102, India
3500 S DuPont Hwy, Dover,
Kent 19901, Delaware, USA


.svg)




3500 S DuPont Hwy, Dover,
Kent 19901, Delaware, USA
L374, 1st Floor, 5th Main Rd, Sector 6, HSR Layout, Bengaluru, Karnataka 560102, India